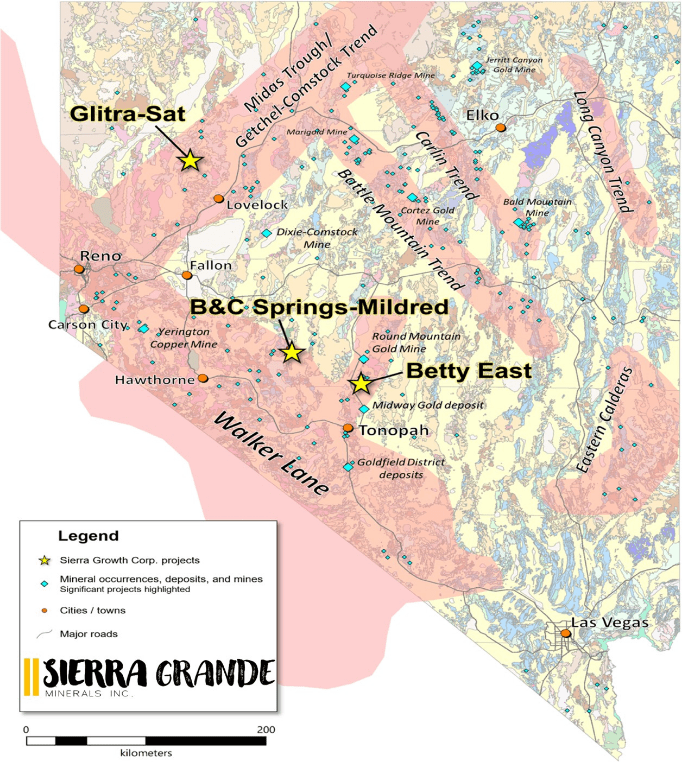
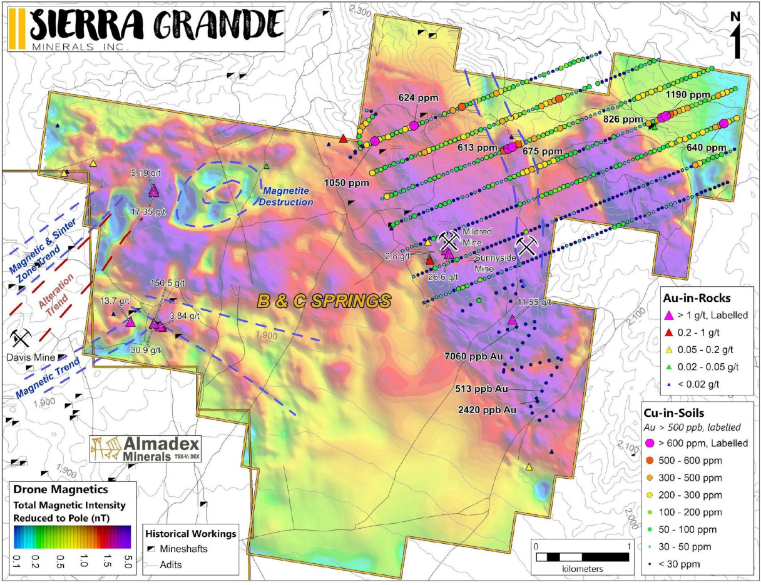
The B&C Springs property is located in the southern Paradise Range in west-central Nevada, within the Fairplay Mining District, which is known mainly for its precious metals potential, but which also hosts a number of copper deposits and occurrences. The B&C Springs property mirrors the potential of the Fairplay District in that it has both base (copper-silver-molybdenum) and precious (gold-silver) metals potential. Much of the focus for previous work at B&C Springs, including a considerable amount of drilling, was on the Mo-Cu-Ag mineralized zone on the east side of the property. However, farther west, in the Mildred Mine area, numerous historical prospecting pits, adits and shallow shafts exist, and the soil geochemical response for gold and silver in that area confirms that there is potential for precious metals mineralization. Still farther west, across the area of the upper pediment blanketing some of the southern part of the property, the Company’s expanded property holdings abut Almadex Minerals Ltd.’s Paradise Valley project, which has long been the focus for precious metals exploration (see Figure 1). The historical work on either side of this pediment area hints at expanded potential for precious metals exploration, particularly beneath the shallow overburden of the upper part of the pediment, and that potential was further reinforced by the results of both Sierra’s recent drone-based aeromagnic survey and its staking-related prospecting program, in which grab samples returned values up to 150.5 g/t gold.

Image 1. Nevada Regional Setting with B&C Springs Project

Image 2. Planview of B&C Springs Property with Gold-in-soils up to 150 grams per ton
In 2022, Sierra undertook a soil geochemical survey across the B&C Springs property aimed at evaluating the precious metals potential. From that work, an extensive northwesterly trending copper-in-soil geochemical anomaly, partly coincident with Mo and Ag, was outlined. It extends beyond the historically drilled area in both directions (see Image 3) and remains open. Interestingly, the historically drilled area has a relatively muted geochemical response (see Image 3), largely because the mineralized zone is capped by a weakly mineralized greenstone or diorite body. The company also completed reconnaissance geological work that suggests the multi-element soil geochemical anomaly is co-spatial with variably veined and chalcopyrite-mineralized granitic dikes that also have a northwesterly trend. Further investigation revealed that, although the dikes are not shown on regional geologic maps of the property, geologic maps immediately to the west (Vitaliano and Callaghan 1963, see Image 2) show an extensive and laterally continuous porphyritic dike swarm which trends southeasterly toward the historically drilled B&C Springs Mo-Cu-Ag zone. To the Company, this suggests that the porphyritic dikes and the mineralization at B&C Springs are related, and that further exploration potential exists along this trend. This association was reinforced by the Company’s drone-based magnetometer survey which outlines many linear magnetic features on the Property with trends mirroring the noted porphyritic dikes and the geochemical anomalies.

Image 3. B&C Springs magnetic survey data with Cu-in-soil geochemical results and USGS geological mapping to the north.

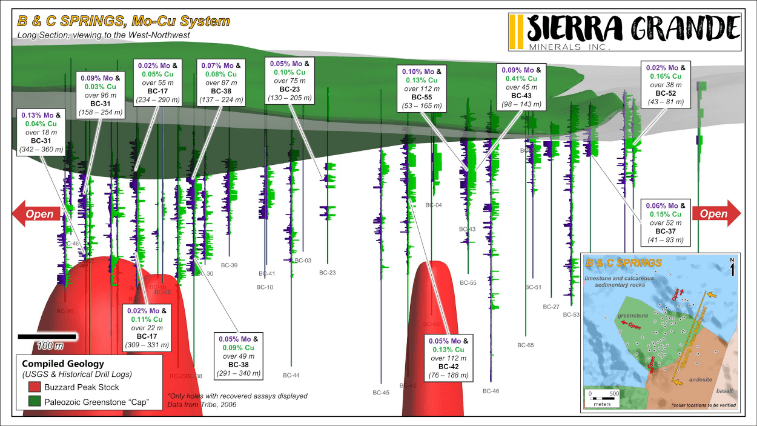
Image 4. Highlighted Historic Drill Results at Copper/Moly Target; Northeast B&C Springs
Extensive drilling was undertaken on the northeastern part of the B&C Springs property, mainly during the 1970’s and early 1980’s. The drilling aimed to delineate a zone of molybdenum (Mo)-copper (Cu)-Silver (Ag) mineralization, which formed the basis for several reports and compilations written as recently as 2007. While the Company is not relying on these historical sources, the data included in them have been compiled and analyzed by Sierra, and include partial assays for 43 vertical drill holes, many of which yielded apparent intersections of significant grade and width. Further, the data indicates that there were as many as 127 holes drilled on the Property, and the results suggest that the modelled mineralized zone largely remained open (see Image 3). Mineralized Mo-Cu intercepts across the dataset encompass an area roughly 2000 x 2300 m.

